How to Measure Community Sentiment by Platform Instead of One Overall Score
An averaged brand score hides the single room doing the most damage, and the fix is a manual read of a hundred mentions per platform with the reason behind every negative one written down.
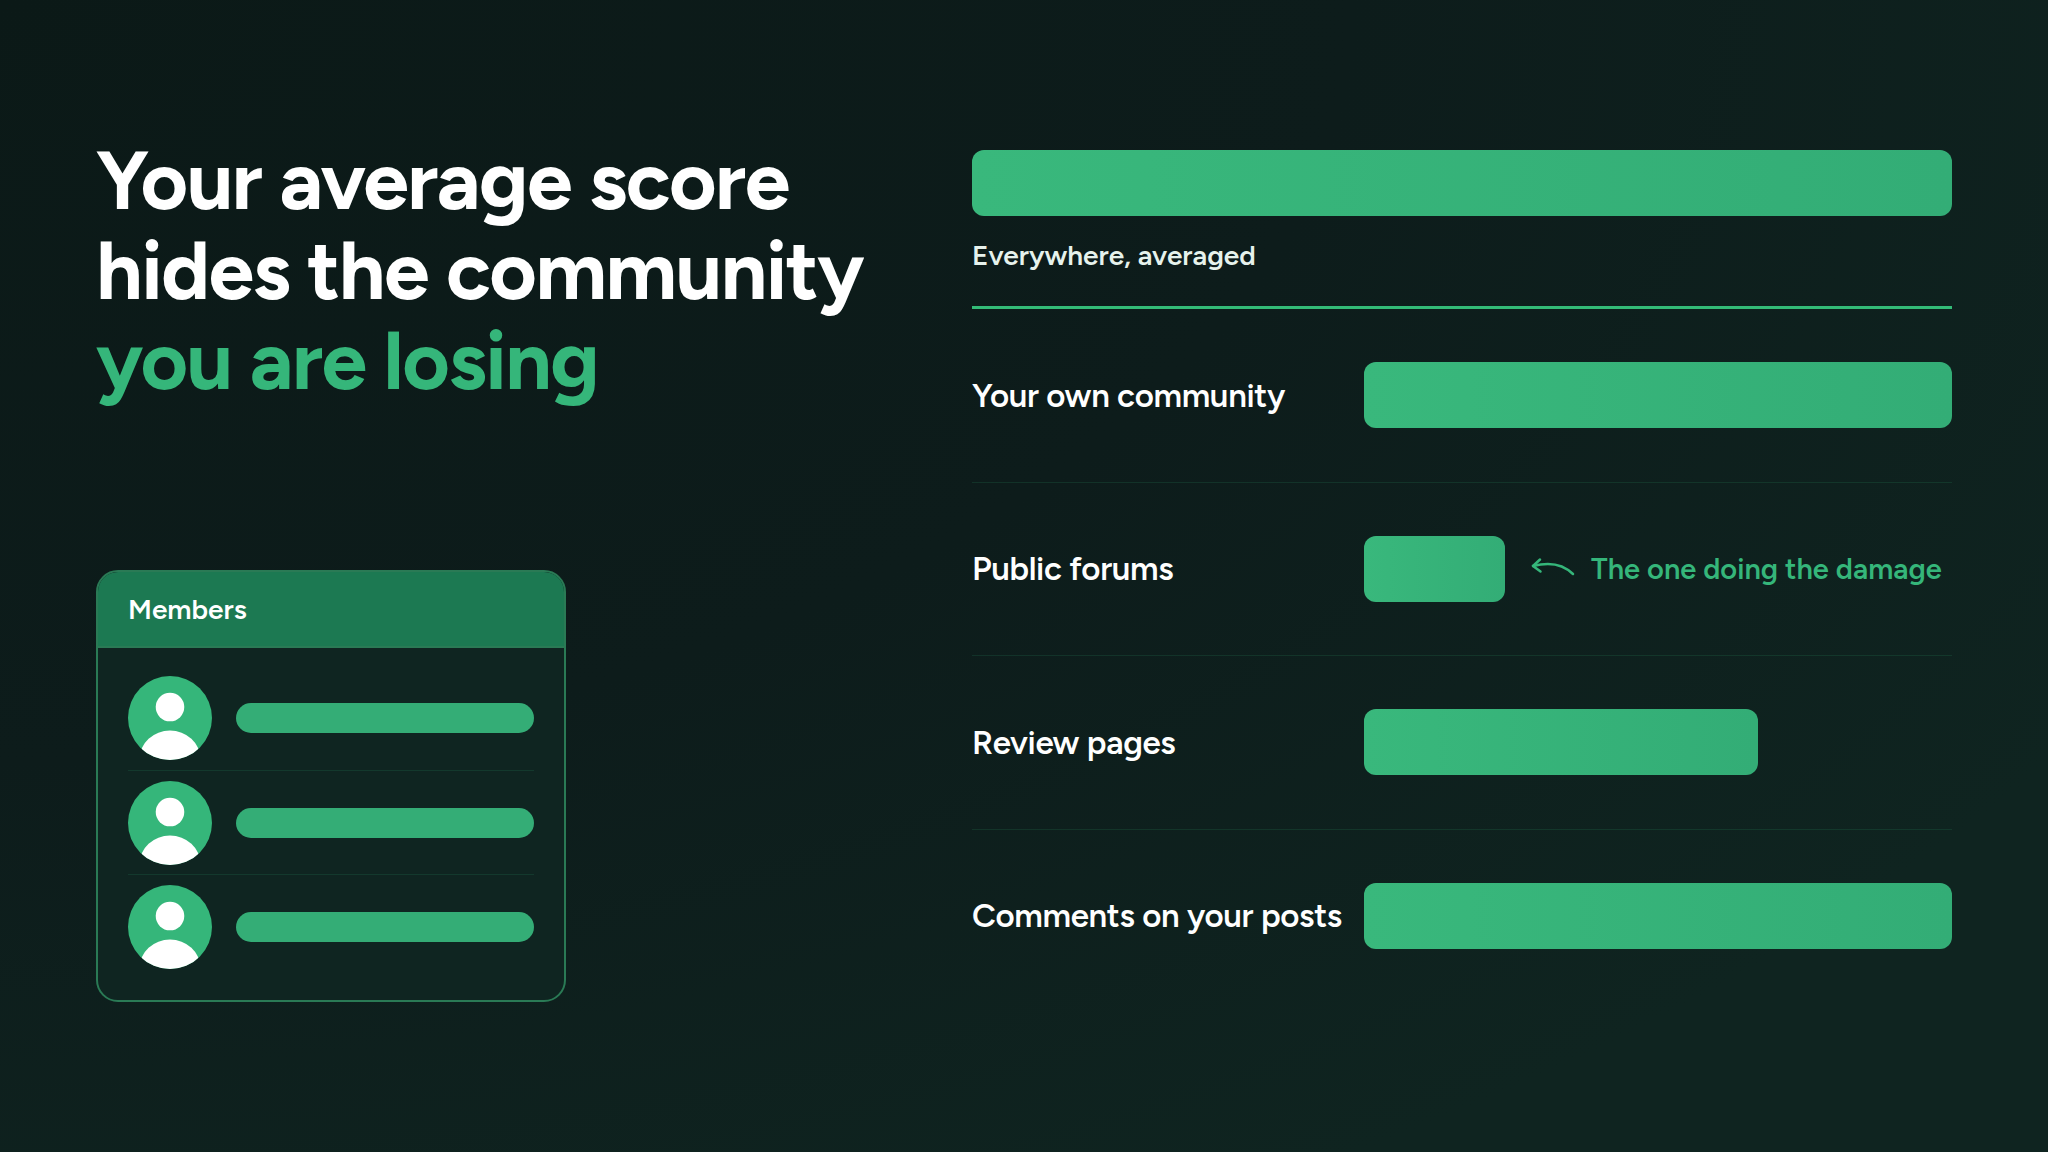
Why the single figure fails
Ask a company how its members feel and a number comes back. High, accurate, and almost impossible to act on.
Ninety percent positive across everything you measure coexists comfortably with one room where the same grievance resurfaces every week from former customers. Thousands of inputs flow into that average and the damaged room is a handful of them. Arithmetic behaves as arithmetic does.
Nobody experiences a brand on average. They experience it in one room.
So the figure rises and falls and no decision follows either way, because nothing inside it points anywhere.
Inventory before metric
The first move is a list, not a measurement.
Name every space your company gets discussed in. The room you own. Public forums. Long-running fan groups on older platforms, routinely the biggest and the least watched. Review pages. The comments under your own posts, which nobody treats as a sentiment surface and which is often the most candid one available.
Put the spaces you neither run nor have a presence in on the list too. Those are where the unmoderated version of your reputation lives, and leaving them off is what makes the resulting picture flattering.
The hundred, read by a person
This step gets handed to software, and handing it over is what manufactures the useless number.
One hundred recent mentions per platform, read by you. Original posts, not summaries. An afternoon per platform, and the one part of this that has no shortcut.
Three piles:
Positive: said something good, unprompted
Neutral: a question or a factual mention
Negative: something is wrong, and you write down what
Everything worth having comes out of the third pile, and specifically out of the note attached to it.
The reason decides the cost
Two platforms, both returning seventy percent positive, same volume.
On one, every negative concerns delivery times. Operations problem, expensive, slow to shift.
On the other, every negative concerns a defect you closed two years ago and never announced anywhere those people read. Communications problem, one good public post, movable this month.
That gap is why a person does the reading. Automated classification handles the three-way sort well and the reason badly, because reasons tend to be implied rather than stated and often live in the replies rather than the post.
The five fields
One dated row per platform.
- Platform. The specific space, not the network it lives on.
- Volume. Mentions found inside the window.
- Split. The three-way sort.
- Top negative reason. The most repeated cause, in plain words.
- Permission to reply. Yes, no, or
not asked yet.
That last field is what stops the sheet becoming a wish list. A poor score in a room whose moderators have declined you is worth knowing and cannot be worked the same way. You move it through the product and through better answers where you are welcome, not through a post you are not allowed to write.
Answer not asked yet honestly. Most teams find several rooms sitting there and have never sent the single message that would settle it.
Same method, every quarter
An unreproducible baseline is a story, not a measurement.
Date the sheet. Note the window, the method, and who read it. Repeat quarterly using that identical method, including when a better one occurs to you, because changing method mid-series measures the change rather than the sentiment.
Two quarters in, you can say the thing a single score never supports: this room improved, that one did not, and here is what was done in each.
Three findings that recur
| What teams expect | What the read shows |
|---|---|
| The loudest platform is the problem | The damage sits in a smaller, older, quieter room |
| The top complaint needs a roadmap | It was fixed already and never announced where it was raised |
| We are present everywhere that matters | One significant room has never been contacted at all |
The middle row is the cheapest win available to most companies and it sits unclaimed, because the fix was announced in the room they own, to people who had already stopped reading it.
Working the sheet
Take the loudest reason on the weakest platform and answer it publicly, in the place people are raising it. One reason, one room, one post.
Then leave it until next quarter. Sentiment shifts slowly and weekly reaction produces noise rather than movement.
What remains is a prioritised list instead of a vague worry. You know which rooms are well, which are damaged, why, and where you have standing to act.
The layer this belongs to
Sentiment measurement and community reporting form one layer of a community operating system, taught here fully enough to install unaided. Its neighbours are separate builds: onboarding and the first forty eight hours, response time, role and channel architecture, support routing, moderation load, escalation paths, documentation, automation coverage, and engagement rhythm.
Measurement sits beneath most of them. A community nobody can describe accurately to leadership ends up defended on member count, which is the number that carries the least information of any you could pick.
Almost every company knows its overall score and almost none can name the room quietly costing them the most. Closing that gap takes a few afternoons and no new software. More at danieljeong.org.
Want a properly managed community?
Get Your Free Analysis →